Graph multiple sequence alignment
Last updated:
This tutorial will cover how to graph multiple sequence alignments on R. I used to use the msa package on R, but the package is no longer compatible with the new Apple M1 because Bioconductor is not compatible with the M1 version of R (i.e. arm64 version). To circumvent this, I will use multiple softwares including Geneious Prime to get our multiple sequence alignments. Alternatively, you can switch to the intel version of R and use Rosetta in order to use the msa package but we will not go over that in this tutorial.
IMPORTANT: This tutorial is for making a nice multiple sequence alignment figure of a short region. It is not for viewing alignments that are thousands of base pairs long.
FASTA file preparation (Geneious)
I am interested in the pf5r gene in Pseudomonas aeruginosa PA14. I have compiled a fasta-style text file with the amino acid sequence of pf5r as well as genes from other P. aeruginosa strains that produced a hit when I blasted the gene against the Pseudomonas Genome Database. You can see a sample of my fasta file by clicking here (clicking the hyperlink will prompt a download).
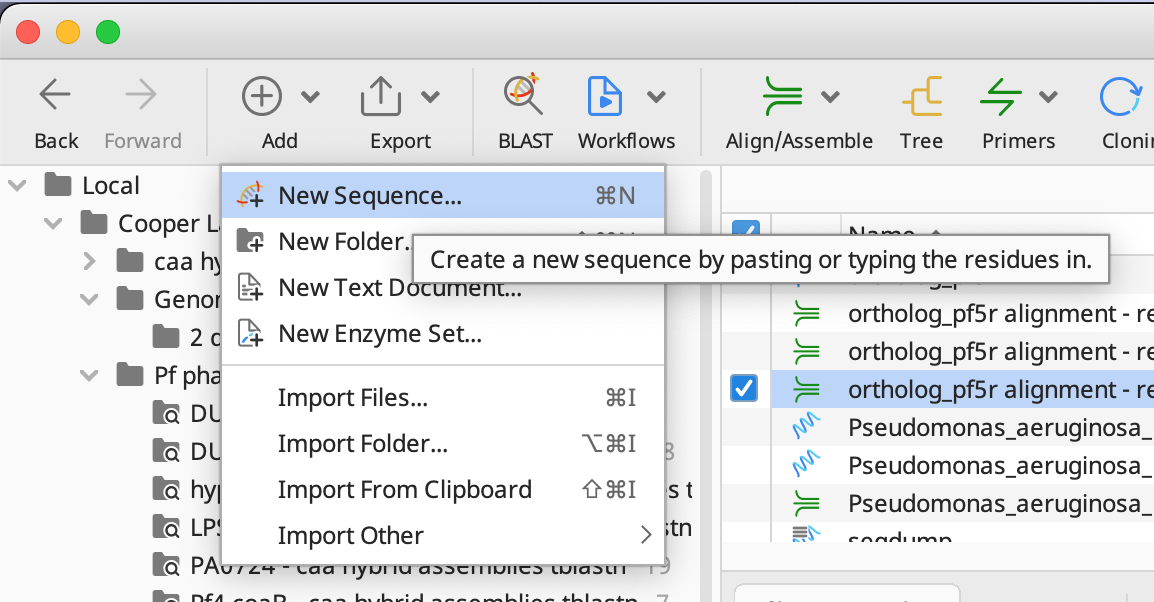
After you have your fasta file, import it into Geneious by clicking on the Add button and selecting New Sequence… as seen below:
Once your fasta file is imported, we will align the sequences. To do so, go to Align/Assemble and select Multiple Align… from the dropdown menu as seen below:

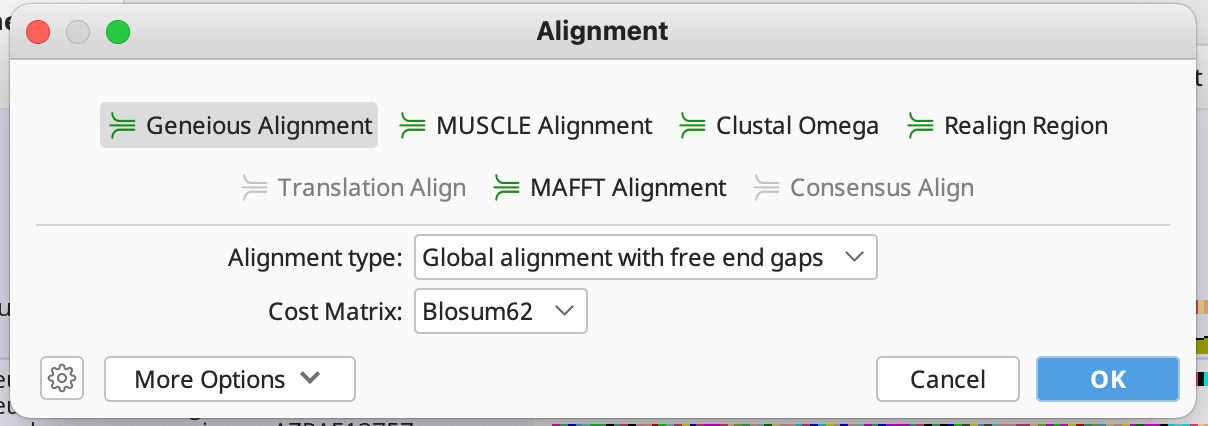
Then choose your desired alignment algorithm. If you are unsure which one to use, see this Geneious article which goes over each algorithm.
After you choose an algorithm, Geneious should output an alignment for all of your sequences. Lets export this by clicking Export and selecting Export Documents… from the dropdown menu:

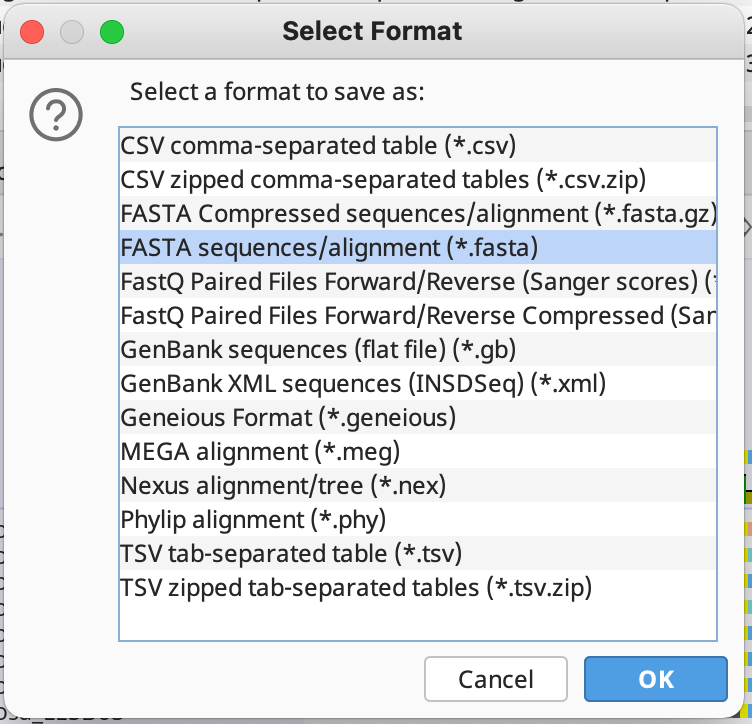
For the export file format, choose FASTA sequences/alignment:
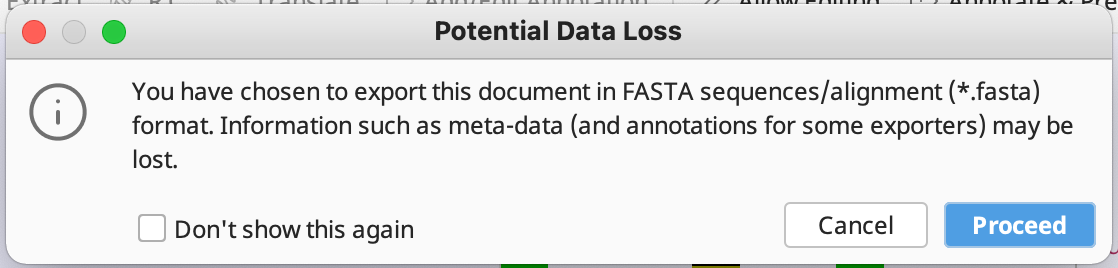
Then select the file location to save the data to. After you have done this, Geneious will ask you about Potential Data Loss. Click proceed for this:
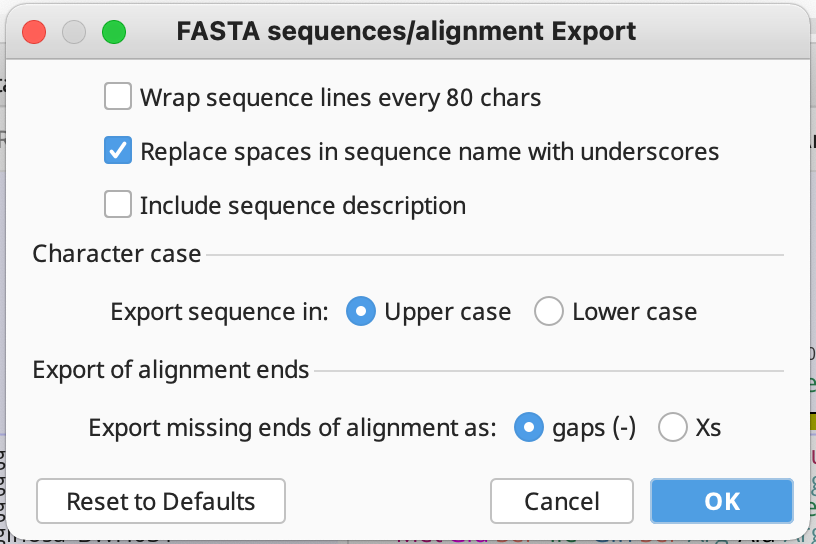
Then it will ask you about FASTA sequences/alignment Export. Make sure to select Replace spaces in sequence name with underscores and Export missing ends of alignment as: gaps(-) as seen below:
Your fasta file should look something like this (click the hyperlink to download multiple alignment fasta file output).
Visualize multiple alignment using ggmsa (R)
Open RStudio and install the ggmsa package.
You can download the package by doing:
if (!requireNamespace("devtools", quietly=TRUE))
    install.packages("devtools")
devtools::install_github("YuLab-SMU/ggmsa")
If the above does not work, try the following:
if (!require("BiocManager", quietly = TRUE))
    install.packages("BiocManager")
BiocManager::install("ggmsa")
Once downloaded, load the ggmsa and ggplot2 package:
library(ggmsa)
library(ggplot2)
Denote the filepath of your multiple sequence alignment fasta into the fasta_filepath variable:
fasta_filepath <- "/Users/kubotan/Downloads/ortholog_pf5r alignment.fasta"
*Note your filepath will be different from mine.
Then once you have done that, you can plot your multiple sequence alignment by:
ggmsa(fasta_filepath, color = "Chemistry_AA", font = "DroidSansMono", char_width = 0.5, seq_name = TRUE, show.legend = TRUE)
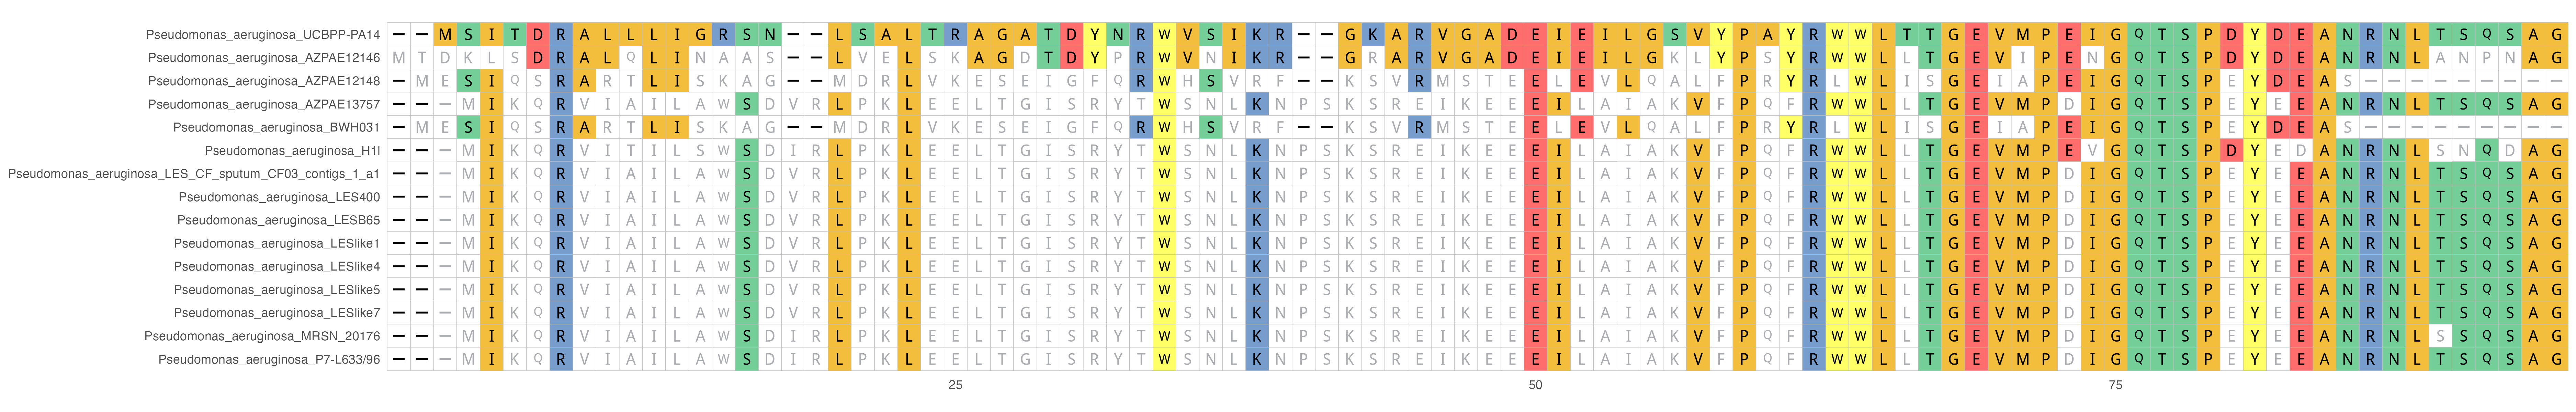
Your plot should look something like this:
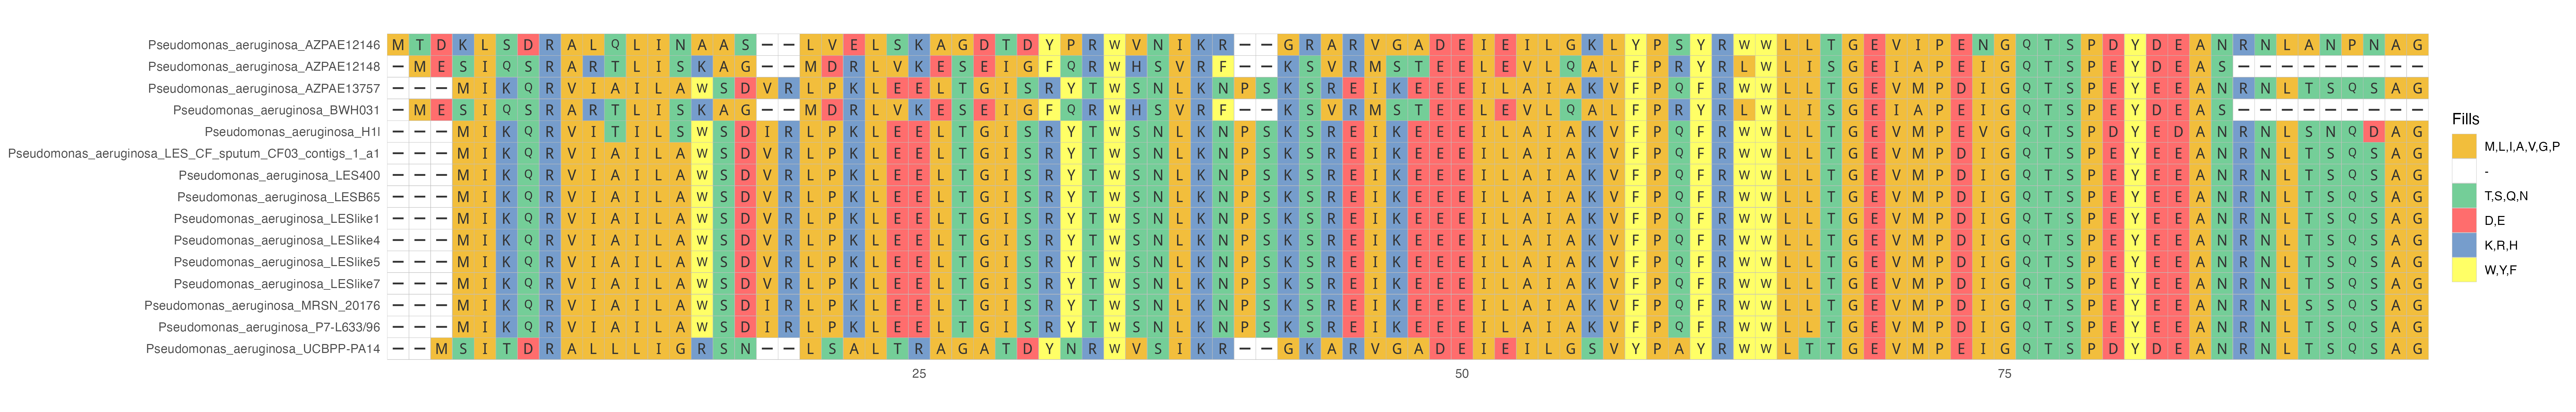
The colors are based on the side-chain chemistry but a lot of the figure can be customized to fit your needs.
Read the ggmsa documentation to further understand how to color and customize your multiple sequence alignment plot.
You can save your plot by doing assigning your ggmsa function as a variable and using the ggsave function to save your picture:
p <- ggmsa(fasta_filepath, color = "Chemistry_AA", font = "DroidSansMono", char_width = 0.5, seq_name = TRUE, show.legend = TRUE)
ggsave(plot=p, "/Users/kubotan/Documents/PMI/Cooper Lab/Prophage/sequences/data/pf repressor comparison/ortholog_pf5r_mutant_alignment.png", height = 7, width = 25, bg="white")
If you would like to select a sequence to become a reference sequence for all your other sequences to align to, you can do this by using the following parameters:
ggmsa(fasta_filepath, color = "Chemistry_AA", font = "DroidSansMono", char_width = 0.5, seq_name = TRUE, ref = "Pseudomonas_aeruginosa_UCBPP-PA14", consensus_views = TRUE, disagreement = FALSE, use_dot = FALSE)
I picked the “Pseudomonas_aeruginosa_UCBPP-PA14” sequence to be my reference in this example.
Then your figure should look like this: